
Using the Signals Page to Monitor Insider Trades and Market Moves
Track insider buying and selling, smart-money portfolio shifts, and stock quality changes all from one central dashboard.
Last updated July 6, 2026
Overview
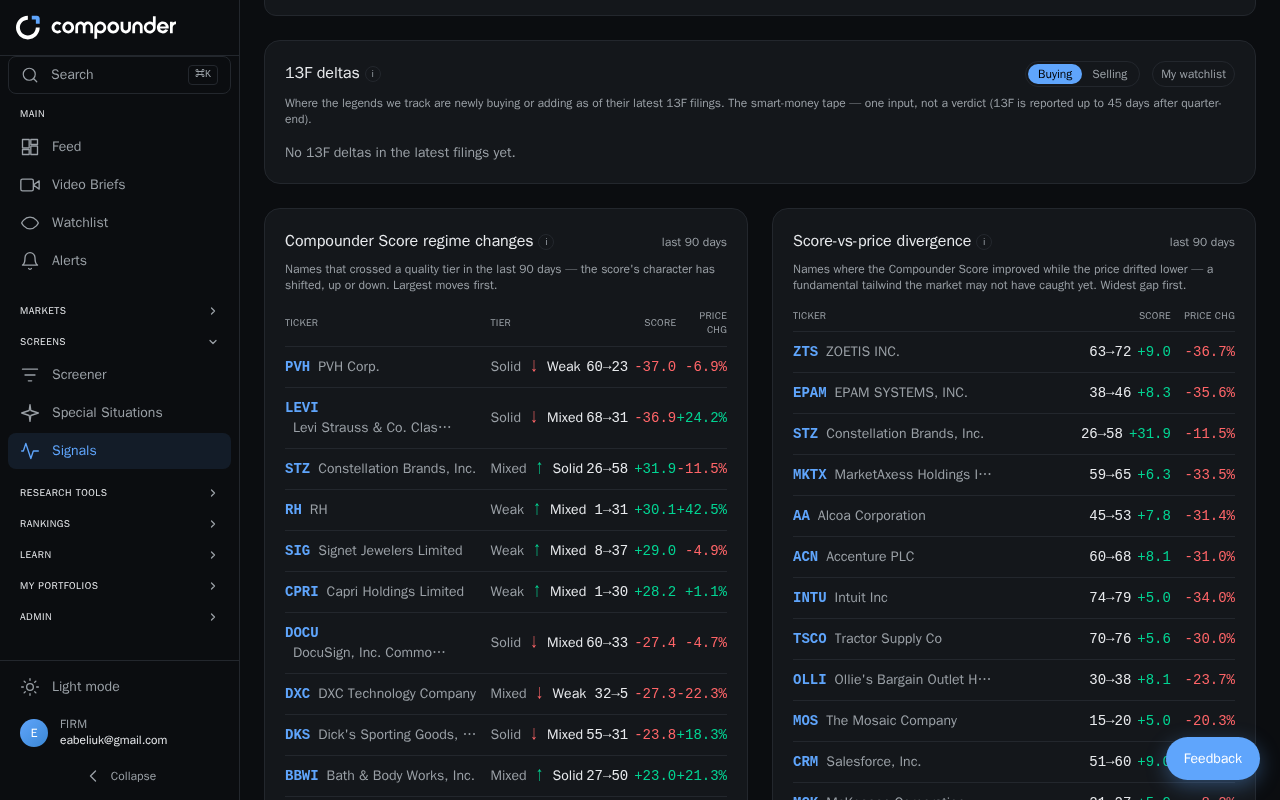
The Signals page — accessible from the main navigation — is a central dashboard that surfaces notable market events across the stock universe. It organizes activity into four types of signal sections, each designed to help you spot potentially meaningful moves before they're widely recognized. Every stock row on the page is clickable, taking you directly to that stock's detail page for deeper research.
Insider Cluster Buys & Sells
Insider trading activity can be a meaningful signal, especially when multiple people act at once. This section shows stocks where three or more insiders — executives or directors — bought or sold shares within the last 30 days.
For each stock, you'll see:
- The number of insiders who traded
- Total shares and dollar value of the activity
- The date range of those trades
A few things to keep in mind when reading this section:
- Insider buys tend to be high-conviction signals. Insiders rarely purchase large amounts of their own company's stock unless they expect positive results ahead.
- Insider sells are noisier and harder to interpret — insiders sell for many reasons unrelated to outlook, such as taxes, personal diversification, or lockup expirations. Treat sells as one input among many, not a definitive warning.
How to use it
- Select Signals from the main navigation.
- Find the Insider Cluster Buys & Sells section.
- Review the list of stocks where 3 or more insiders have traded in the past 30 days.
- Prioritize stocks with insider buys as stronger signals than those with insider sells.
- Click any ticker to open its detail page and research further.
13F Deltas (Smart Money Tape)
Large investment managers are required to file quarterly reports — called 13Fs — disclosing their stock holdings. This section surfaces the most notable moves made by well-regarded, high-profile investors, so you can see which stocks they're entering or exiting.
For each stock, you'll see:
- The ticker symbol
- How many notable investors are making moves in that stock
- Which specific investors are active
- The total dollar value of their activity
You can filter this section in two ways:
- Use the Buying / Selling toggle to switch between new positions or additions (buying) and trims or full exits (selling).
- Click My watchlist to narrow the view to only stocks you're already tracking.
Important: 13F filings are submitted up to 45 days after each quarter ends, so the information in this section reflects past positions, not real-time holdings. Use it as context for your research rather than as a live feed.
How to use it
- Go to Signals from the main navigation.
- Scroll to the 13F Deltas (Smart Money Tape) section.
- Toggle between Buying and Selling to filter by activity type.
- Optionally click My watchlist to see only stocks you follow.
- Review the investor names, number of active investors, and dollar value for each stock.
- Click a ticker to explore the stock's detail page.
Compounder Score Regime Changes
The Compounder Score is a 0–100 quality metric that rates stocks across fundamental dimensions. This section highlights stocks where that score has recently crossed into a new quality tier — moving between Weak, Mixed, Solid, and Excellent — within the last 90 days.
- Up arrows indicate improving fundamentals — these stocks may be worth a fresh look.
- Down arrows indicate deteriorating fundamentals — a cue to review your thesis if you hold the stock.
Think of this section as a screening tool for quality changes, not as a direct buy or sell recommendation.
How to use it
- Go to Signals from the main navigation.
- Find the Compounder Score Regime Changes section.
- Look for up arrows to identify stocks whose quality has recently improved.
- Click a ticker to research the stock further on its detail page.
Score-vs-Price Divergence
Sometimes a company's underlying quality improves while its stock price drops — a gap the market may not have recognized yet. This section highlights exactly those situations: stocks where the Compounder Score went up while the price went down.
Each row shows the score movement and the accompanying price change, giving you a quick sense of the size of the divergence. These are research starting points, not confirmed buying opportunities — always investigate the reasons behind a price decline before acting.
How to use it
- Go to Signals from the main navigation.
- Locate the Score-vs-Price Divergence section.
- Review stocks where the score improved but price fell.
- Click a ticker to dig into the stock's detail page and understand whether the divergence represents a genuine opportunity.
What's Coming Next
The Signals page also includes a Coming Soon area previewing additional signal types — such as earnings surprises — that will be added in the future.