
Tracking Legendary Investor Portfolios
Learn how to explore what top investors are buying, selling, and holding — and use their moves to discover new stock ideas.
Last updated July 5, 2026
What is the Legends feature?
The Legends feature lets you browse the real stock portfolios of well-known investors, based on their quarterly SEC 13F filings. You can see every position they hold, track what they recently bought or sold, compare portfolios across time, and click through to research any stock they own.
Finding an investor's portfolio
To get started, go to the All Legends page and click on any investor's name. This opens their Legend Portfolio Details page, which shows a complete snapshot of their most recent quarterly filing. If you have a direct link to a specific investor, you can navigate there as well.
Understanding the portfolio overview
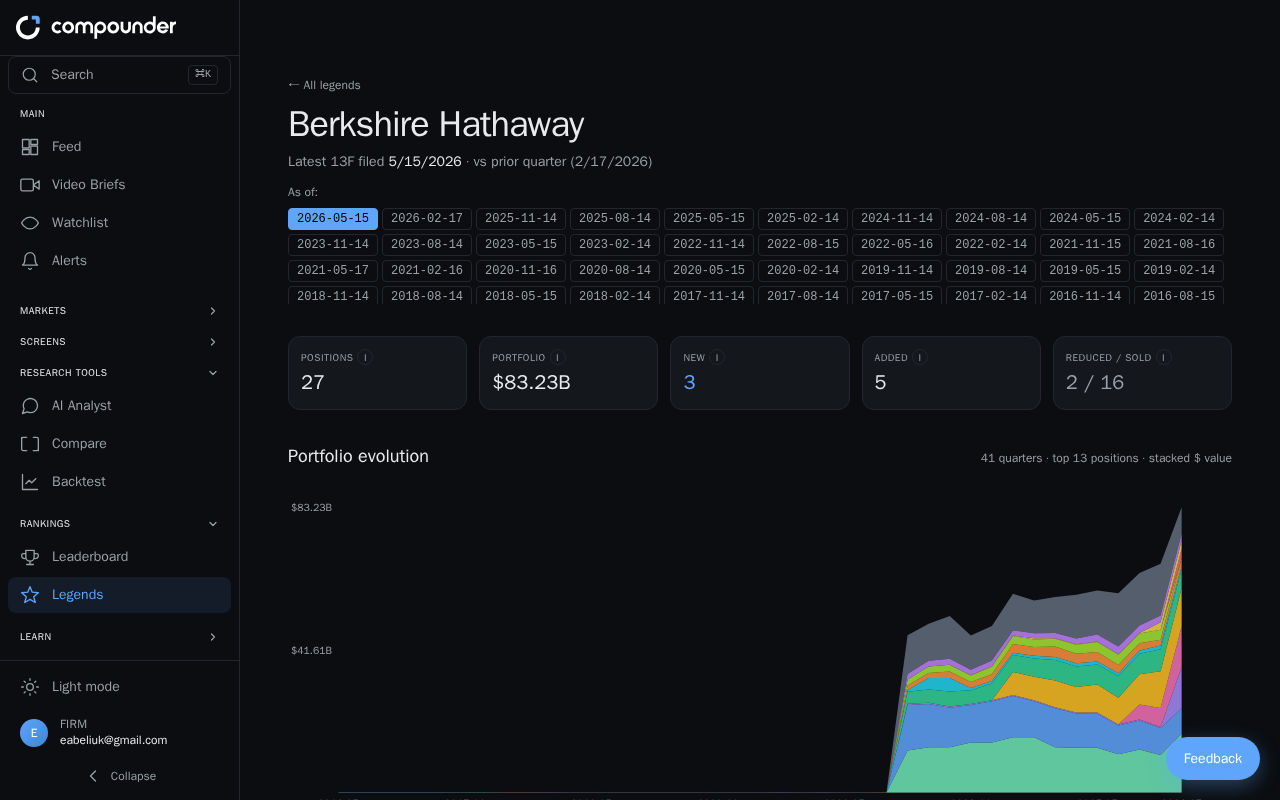
At the top of the Legend Portfolio Details page you'll see the investor's name and the date of their most recent filing. Below that, a summary section gives you key stats at a glance:
- Total positions — how many stocks they currently hold
- Portfolio value — the total value in USD
- Activity breakdown — counts of new buys, increased positions, reduced positions, and complete exits compared to the prior quarter
A chart below the summary shows how the investor's total portfolio value has changed over time, giving you a sense of their overall trajectory.
Reading the Holdings table
The main Holdings table lists every stock position in the portfolio. For each row you can see the ticker symbol, company name, dollar value, and portfolio weight. The table shows up to 200 positions by default; if the investor holds more, a note will indicate that.
The most useful column for spotting activity is the colored Delta badge next to each ticker. These badges tell you exactly what action the investor took this quarter:
- NEW — a first-time buy, not previously in the portfolio
- ADDED — an existing position that was increased
- REDUCED — a position that was partially trimmed
- SOLD OUT — a position completely exited (also listed in a separate Sold Out section at the bottom)
- No badge — position is unchanged from the prior quarter
You can sort the table by any column — value, weight, or activity type — to focus on what matters most to you. Click the chevron next to any ticker to expand that row and see a chart of how the investor's share count in that stock has changed over past quarters.
Discovering new stock ideas
Any ticker in the Holdings table is clickable. Clicking it takes you to that stock's detail page, where you can dig into its fundamentals, valuation, performance, and more. To find the investor's freshest ideas, focus on positions marked NEW or ADDED — these represent stocks the investor recently started buying or chose to increase, which can be a strong signal of conviction.
- Open the legend's portfolio page.
- Scan the Delta column for NEW and ADDED badges, or sort the table to group those positions together.
- Click any ticker you want to research further.
- Review the stock's fundamentals, valuation, and other data on its detail page.
Comparing portfolios across quarters
Investor strategies evolve over time, and you can follow that evolution by switching between filing periods. In the header area of the Legend Portfolio Details page, look for a dropdown menu showing available filing dates. Click it and select any earlier quarter to instantly reload the page with that period's data — the summary stats, portfolio chart, and Holdings table all update together.
Switching back and forth between quarters lets you see whether the investor has been growing or trimming specific positions, rotating into new sectors, or concentrating their portfolio over time. A comparison note near the top of the page highlights how the selected quarter's holdings differ from the one before it.
- Open a legend's portfolio page.
- Find the filing date dropdown in the header area.
- Select an earlier quarter to view that period's snapshot.
- Compare the summary stats and Holdings table to spot trends.
- Switch back to the latest quarter to see where things stand today.