
Comparing Stocks Side by Side
Use the Compare page to evaluate key financial metrics and Compounder Scores for up to four stocks at once.
Last updated July 6, 2026
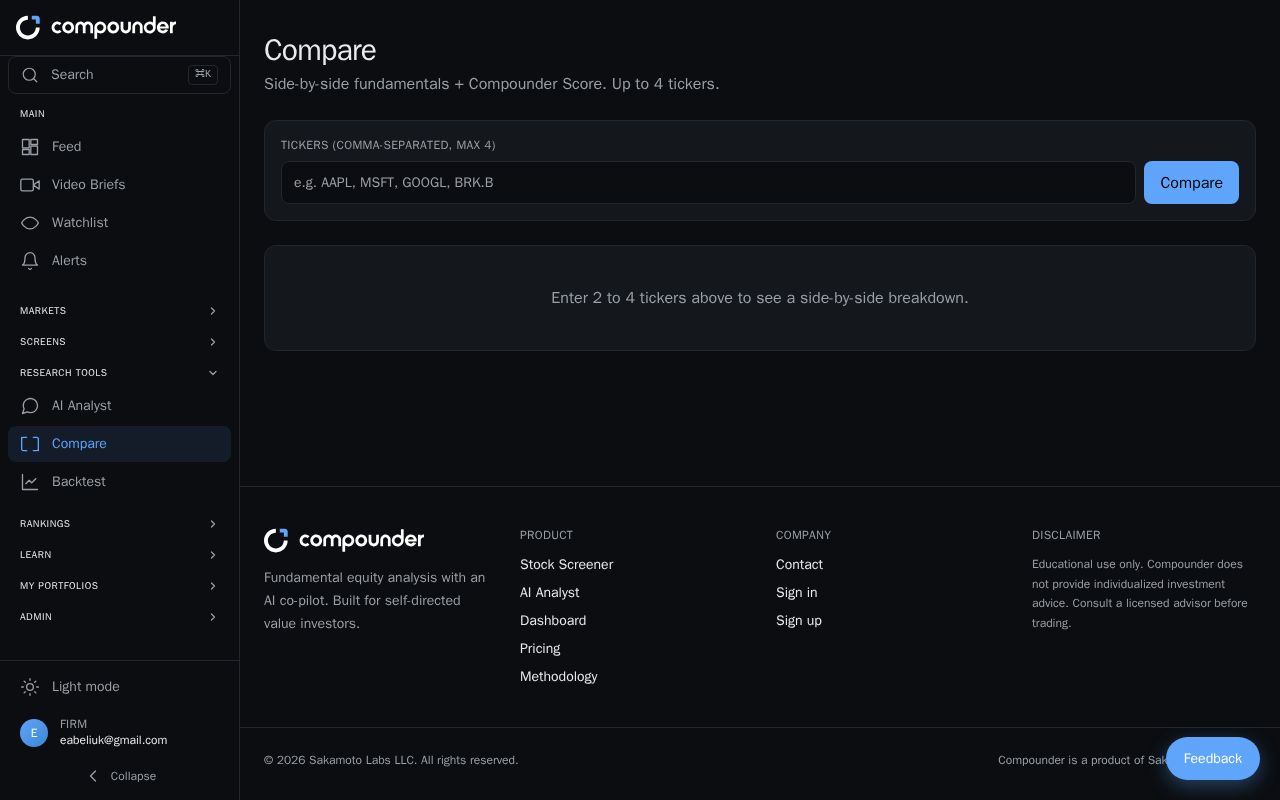
What the Compare Page Does
The Compare page lets you place two to four stocks next to each other so you can quickly spot which companies lead or lag on price, market size, and scoring components. This is especially useful when you're evaluating competitors in the same sector and want a clear, structured view before diving deeper into any one stock.
Setting Up Your Comparison
- Open the Compare section from the main navigation menu.
- Enter your stock symbols in the Tickers input field, separated by commas — for example: AAPL, MSFT, GOOGL. You can enter between 2 and 4 symbols at a time.
- Use the autocomplete dropdown that appears as you type to quickly find and select the exact tickers you want.
- Click the Compare button to load your results.
Reading the Comparison Table
Once you click Compare, a table appears showing each stock in its own column. For every stock you'll see:
- Company name — the full company name for easy identification.
- Sector — helpful for confirming you're comparing true industry peers.
- Price — the current share price.
- Price Change — shown in green for gains and red for losses.
- Market cap — the total market value of the company.
Understanding Compounder Scores
Below the overview metrics, each stock displays its overall Compounder Score on a scale of 0–100. This score is broken down into five components, each rated on a numeric scale (for example, 8.5 / 10):
- Profitability — how effectively the company generates earnings.
- Capital Structure — balance sheet strength and debt levels.
- Cash Quality — the quality and stability of the company's cash flows.
- Valuation — how the current price compares to underlying fundamentals.
- Stability — the consistency and predictability of the company's results over time.
Scanning across these component scores makes it easy to see, for example, which competitor carries the least debt or which one looks most attractively valued right now.
Exploring a Stock in More Detail
If a stock in the comparison catches your eye, click its ticker symbol in the table header. This takes you directly to that stock's full detail page, where you can explore its complete profile and analysis.