
Browsing and Filtering the Stock Universe
Learn how to explore all covered companies using sector, size, and quality filters on the Browse Stocks page.
Last updated July 6, 2026
Overview
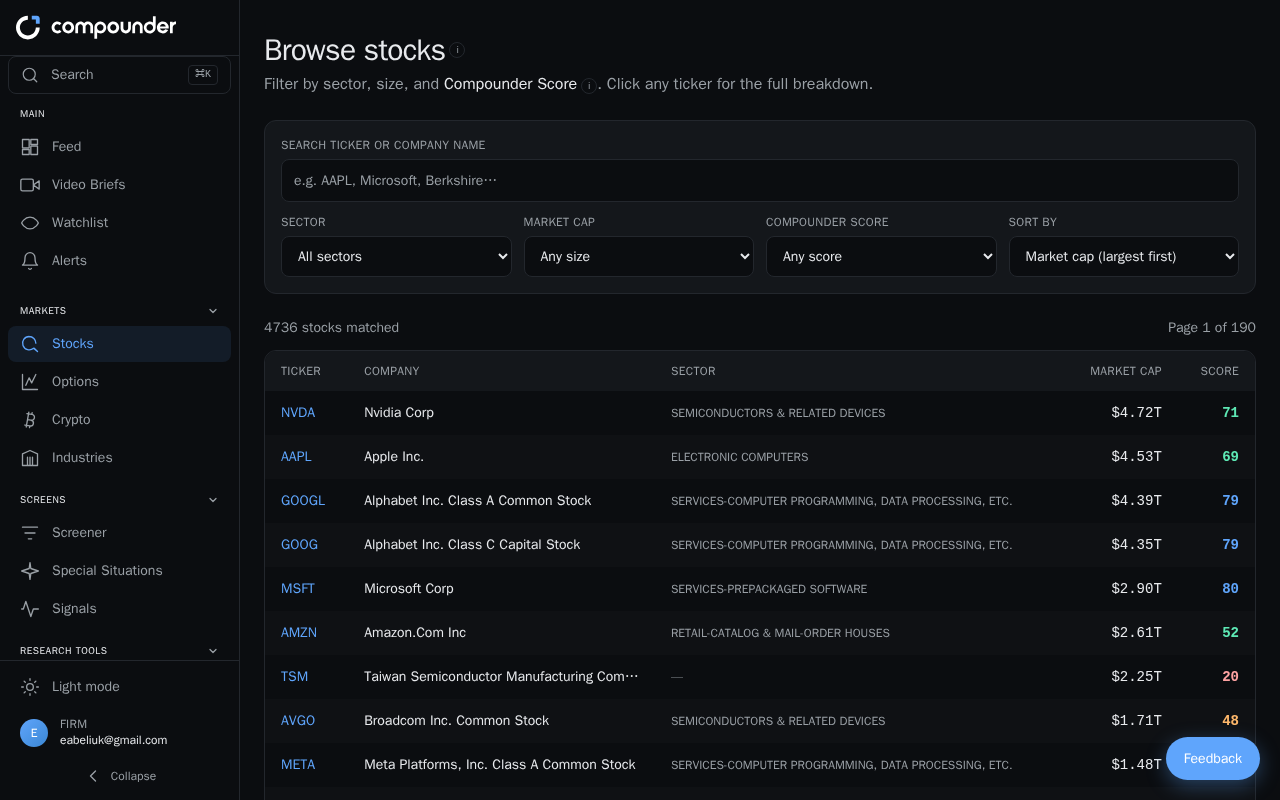
The Browse Stocks page gives you access to the full universe of covered companies — every business with available financial data. From here you can search, filter, and sort to zero in on exactly the kinds of stocks you want to explore, then jump straight into a full financial breakdown for any company that catches your eye.
Finding the Browse Stocks Page
Select Browse Stocks from the main menu. The page loads with all covered companies displayed in a results table, along with a filter card at the top.
Understanding the Results Table
Each row in the results table shows five key pieces of information:
- Ticker — a clickable link that opens the full financial breakdown for that company
- Company name
- Sector
- Market cap
- Compounder Score — color-coded so you can spot quality at a glance (green for excellent scores, orange for weak ones)
A result count and page number appear above the table. Use the Previous and Next buttons to move between pages when there are many results.
Searching for a Specific Company
Type a ticker symbol, company name, or partial match into the search field in the filter card. The results update automatically as you type — no need to press a button.
Filtering by Sector
Open the Sector dropdown in the filter card and choose a specific industry — such as Technology or Healthcare — or leave it set to All sectors to see the full universe. The table immediately narrows to companies in your chosen sector.
Filtering by Market Cap
Use the Market cap dropdown to focus on companies of a particular size:
- Any size — no filter applied
- Mega cap — over $200B
- Large cap — $10B–$200B
- Mid cap — $2B–$10B
- Small cap — $300M–$2B
Filtering by Compounder Score
The Compounder Score measures overall company quality based on profitability, capital structure, cash quality, valuation, and stability. A tooltip on the filter explains the methodology. Use the Compounder Score dropdown to choose a quality tier:
- Any score — no filter applied
- Excellent — 75 and above
- Solid — 50–75
- Mixed — 25–50
- Weak — below 25
Sorting Your Results
Once you've set your filters, use the Sort by dropdown to control the order of the results table:
- Market cap (largest first)
- Compounder Score (highest first) — great for surfacing the highest-quality stocks in a sector
- Compounder Score (lowest first)
- Ticker (A–Z)
Exploring a Stock in Detail
When a company in the results table looks interesting, click its ticker. This opens the full financial breakdown and scoring methodology for that company.
Putting It All Together: Finding High-Quality Stocks in a Sector
- Go to the Browse Stocks page from the main menu.
- Open the Sector dropdown and select the industry you want to explore.
- Open the Compounder Score dropdown and choose a quality tier — for example, Excellent to focus on the strongest companies.
- Open the Sort by dropdown and select Compounder Score (highest first) to rank the remaining results by quality.
- Review the filtered table. Use Previous and Next to page through results if needed.
- Click any ticker to dive into that company's full financial details.