
Backtesting and Building a Stock or Options Strategy
Learn how to run historical backtests on stock-picking strategies and construct multi-leg options strategies with visual payoff analysis.
Last updated July 5, 2026
Overview
The platform offers two complementary strategy tools: a Stock Strategy Backtester that shows how a stock-selection approach would have performed over any historical period, and an Options Strategy Builder that lets you construct and analyze multi-leg options positions before placing a trade. This guide walks you through both.
Part 1: Backtesting a Stock-Picking Strategy
The Backtest section lets you test how different stock-selection approaches would have performed against real historical market data — including how they compare to popular benchmarks like the S&P 500.
Step 1: Open the Backtest Section
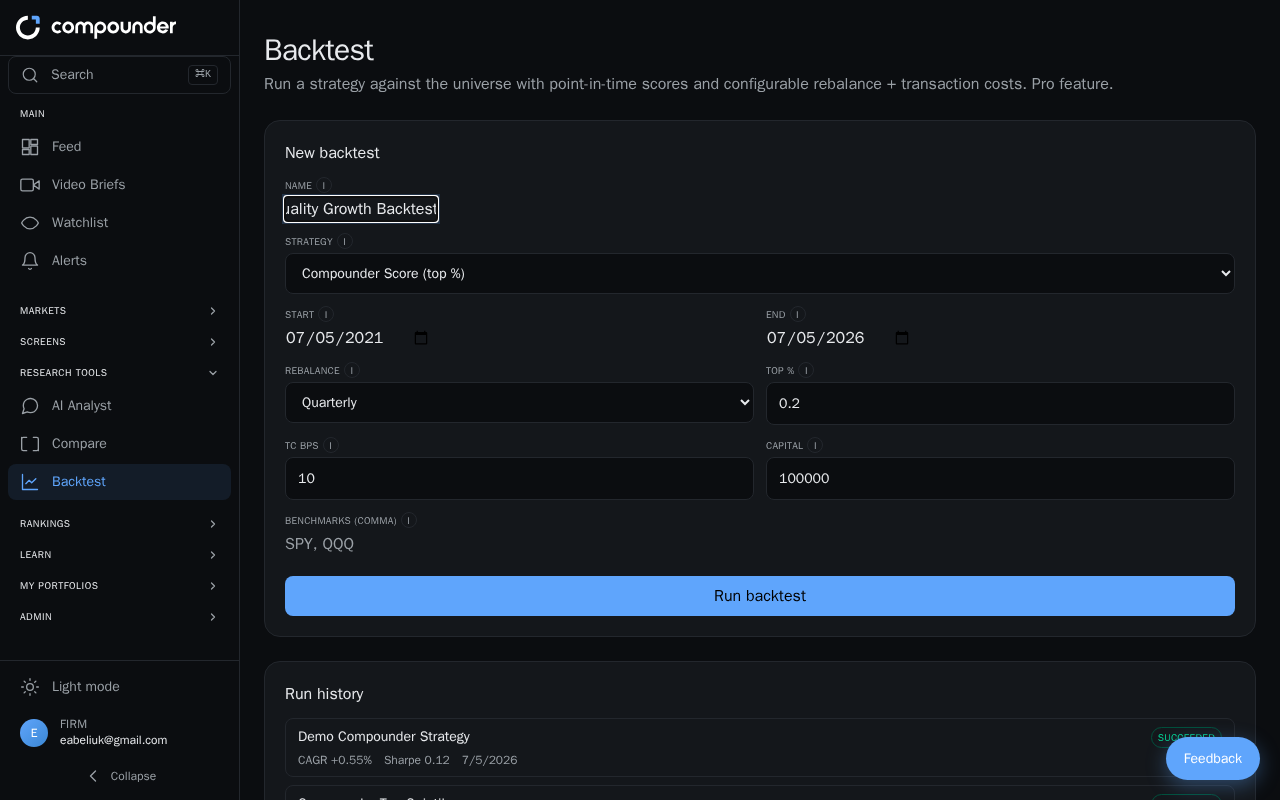
Select Backtest from the main navigation. You'll see a configuration form on the left and a results area on the right.
Step 2: Name and Configure Your Test
Fill in the form on the left side:
- Name — Enter a memorable name so you can find this test again later.
- Strategy type — Choose one of three approaches:
- Compounder Score top percentile — selects the top-scoring stocks by a composite quality-and-growth score
- Buffett quality — selects stocks meeting a quality scoring threshold
- Graham net-net value — selects deeply undervalued stocks using a classic value method
- Historical date range — Set a start date and end date. The two dates must be at least 90 days apart.
- Rebalance frequency — Choose how often the portfolio is updated: Monthly, Quarterly, or Yearly.
- Percentage of universe to hold — If you selected the Compounder Score strategy, enter the fraction of the stock universe to hold (for example, enter 0.20 to hold the top 20%).
- Transaction costs — Enter a cost in basis points. A typical value is 10 bps.
- Starting capital — Enter your starting amount in USD. This affects the dollar figures shown in results but does not change the percentage returns.
- Benchmarks (optional) — Add up to 5 ticker symbols, separated by commas (for example, SPY, QQQ), to compare your strategy's performance against them.
Step 3: Run the Backtest
Click Run backtest. The button will show Running... along with a live progress indicator while the test processes. Depending on the date range and strategy, this may take a moment.
Step 4: Review Your Results
Once complete, the right side of the screen displays:
- An interactive equity curve chart showing how your strategy's portfolio value grew (or declined) over time, plotted alongside any benchmarks you added
- A metrics card with key performance figures: CAGR, Sharpe ratio, Volatility, and Max Drawdown
- The total number of rebalances that occurred during the test period
Hover over the chart to see exact values at any date. Use the chart legend to toggle individual benchmark lines on or off. All past backtests are saved and can be selected again from the run history to revisit results at any time.
Part 2: Building a Multi-Leg Options Strategy
This feature is available to Pro tier users and above only. Free users will see an upgrade prompt when visiting the Options page.
The Options Strategy Builder lets you explore live option chains for any stock, analyze contract details including Greeks, and assemble multi-leg strategies — such as vertical spreads, straddles, or covered calls — with an interactive payoff diagram that updates as you build.
Step 1: Load an Option Chain
Navigate to the Options page from the main menu. Enter a stock ticker symbol in the search field and click Load chain. The page will display the underlying stock's current spot price, an expiration date selector, and a call/put toggle.
Step 2: Browse the Options Table
Use the expiration date selector to switch between available contract dates, and the call/put toggle to view calls or puts. The options table shows each contract's strike price, last price (bid/ask midpoint), implied volatility (IV), Delta (price sensitivity), Theta (daily time decay), and open interest.
Step 3: Add Legs to Your Strategy
Click + Add next to any contract to add it as a leg in your strategy builder. Repeat this for each contract you want to include — for example, adding a call at one strike and a call at a different strike to form a vertical spread. For each leg you add:
- Click the BUY / SELL button to toggle whether you are buying or selling that contract.
- Edit the quantity field to trade more than one contract per leg.
- Click × to remove a leg if you change your mind.
Step 4: Analyze Your Strategy
As you add and adjust legs, the analysis panel updates automatically in real time to show:
- Net debit or credit — the total cash required to open (or received to open) the position
- Breakeven points — the stock price(s) at which the strategy breaks even at expiration
- Maximum profit and maximum loss
- Probability of profit at expiration
- An interactive payoff diagram showing your profit or loss across a range of possible stock prices
Continue adjusting quantities, toggling buy/sell, adding or removing legs, and watching the payoff diagram update until you are satisfied with the risk/reward profile of your strategy.